The 2026 Senedd elections delivered the most significant shift in Cardiff Bay’s political landscape since its formation in 1999, combining a large influx of new personnel with an entirely redrawn electoral map. For both new and returning Members of the Senedd (MSs), getting to grips with these newly established boundaries and understanding the evolving needs of their constituents is a top priority.
That makes constituency data profiles far more than just a tool for public affairs teams targeting political engagement. They are an essential resource for MSs, as they seek to understand the local demographics, economic pressures, and public service demands of their electorate.
While creating Senedd constituency dashboards can seem complicated at first, readily available geographic data simplifies the first step in building your profiles.
Where to find the data driving constituency profiles
Government departments and public organisations release fresh data every week covering a broad range of topics, from NHS waiting times to energy, housing, and education. A variety of dedicated databases host these datasets across different geographic levels in Wales.
Gov.Wales
Gov.Wales is the main source of the Welsh Government’s public releases, including open data. The site features a Statistics and Research release calendar that aggregates publications across Welsh platforms, serving as a go-to hub for data research. It also includes an upcoming page detailing future statistical releases.
In the wake of the new Senedd boundaries, Gov.Wales hosts the ‘Data for Senedd Cymru constituency areas’ dataset. This includes tables on demographics, deprivation, economy, education, health, housing, environment and road collisions.
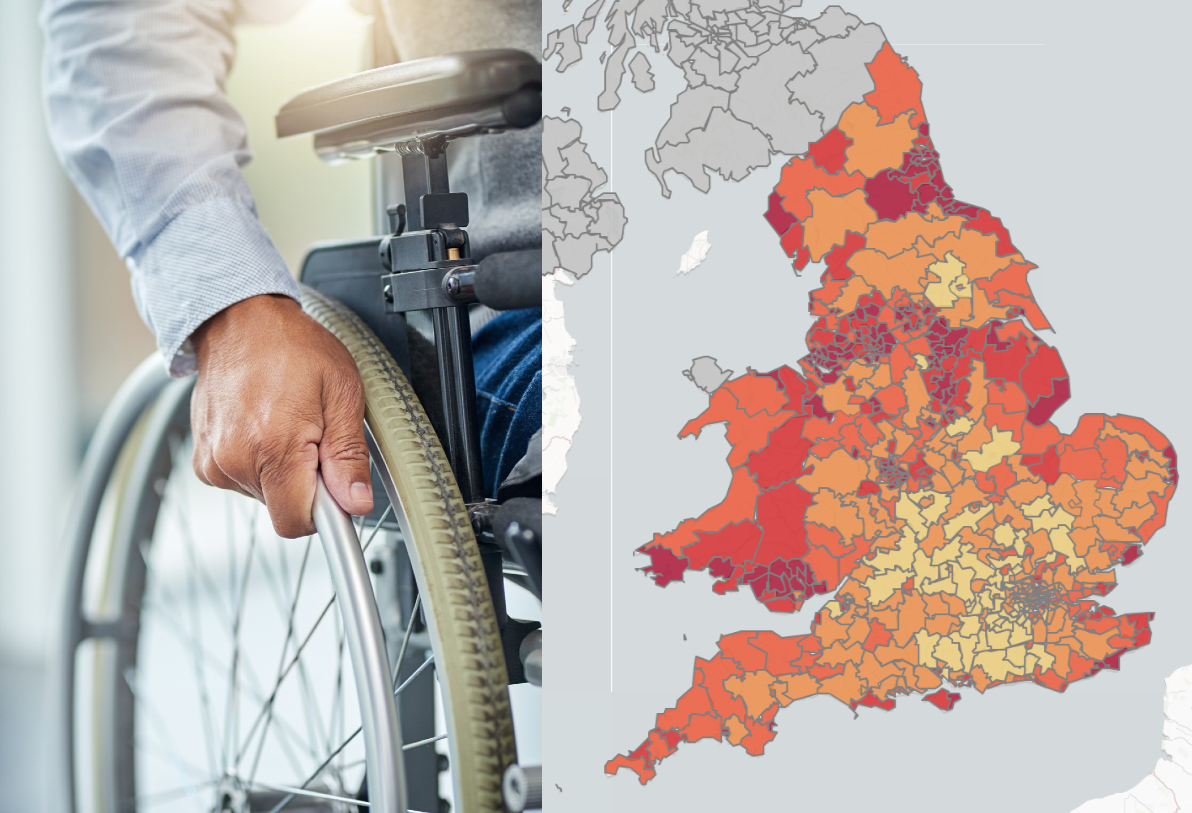
Additionally, the site is home to the National Survey for Wales, a regularly updated dataset that collects public sentiment data across different geographies in Wales. It also features the Welsh Index of Multiple Deprivation (WIMD), providing neighbourhood-level data on deprivation across the country (see visualisation below).
StatsWales
At the end of 2025, the Welsh Government launched a revamped data platform making it easier to explore and create tailored datasets. The new StatsWales is designed for ongoing, granular data exploration, with interactive menus and tables to generate curated datasets straight from the platform.
The site features a wide variety of geographic boundaries. While most data is published at the health board and local authority levels, select releases are available by constituency.
DataMapWales
DataMapWales is a resource built specifically for location-based visualisation, offering geographic datasets to map layers, explore boundaries, plot facilities, or extract spatial data. Besides geospatial boundary data, the platform also includes niche datasets, such as GP practice locations, rainfall patterns, and air quality metrics.
Public Health Wales
The NHS Wales network hosts a variety of health data dashboards offering extensive breakdowns on disease prevalence and health services by demographics and geographies. This helps inform care and provides key information on the performance of health services across Wales.
Other databases
Although the above sources provide the majority of datasets covering Welsh geographies, UK-wide open data platforms are a good source of alternative releases:
- Census 2021: Wales conducts its Census survey alongside England. The Office for National Statistics hosts an open data dashboard offering both standardised and custom datasets displaying the Census results by a variety of boundaries, from Westminster constituencies and local authorities to Welsh health boards and Senedd constituencies. The 2021 Census surveyed populations across England and Wales on education, employment, health, demographics, and Welsh language skills.
- Office for National Statistics (ONS): The ONS includes many datasets covering all UK nations, from Labour Market figures updated monthly at the local authority level, to mortality and social care data.
- Gov.UK: Similar to Gov.Wales, Gov.UK is the main source of open data for the whole of the UK, hosted by the UK government. This site includes a release calendar displaying datasets published across government departments by date, covering non-devolved topics that apply to Wales.
How to adapt geographic boundaries
Despite the large availability of datasets representing a variety of Welsh geographies, data published at the Senedd constituency level may not be readily available for your chosen topic. That is why a common next step is applying data conversion methods. Whether you are struggling to find Senedd constituency data or your required data is only available at the local authority or health board level, one of the methods below can help.
Data assignment
Data assignment processes offer a quick turnaround to create constituency outputs for MS engagement.
Taking local authority data as a starting point and using an overlap analysis, determine which Senedd constituency a local authority sits in. Due to the large size of Senedd constituencies, most will overlap with multiple boundaries; however, a specific local authority will often occupy the majority of the constituency footprint. This analysis identifies which boundaries occupy the most space in a given constituency and simply allocates the respective data point, avoiding complex data modelling.
Data conversion
Alternatively, an overlap analysis coupled with population data can be used to produce Senedd constituency-specific data. While this method requires more complex data modeling, it delivers greater granularity to the final outputs.
Starting with a similar spatial analysis, determine the geographic overlap between both boundary levels and combine this with local population figures to establish a weighting multiplier. For absolute counts, apply this multiplier to the original data and aggregate the transformed data points to derive a constituency total. For rates, assign the exact value when there is a single boundary overlap or calculate a weighted average when spanning multiple boundaries.
Additionally, because UK Parliament constituencies fit neatly within the new Senedd boundaries, a simplified conversion method can be used when starting from Westminster data. In these cases, absolute counts are simply aggregated, while rates are calculated using a weighted average.
Visualising constituency profiles
Once a final dataset is in hand, visualising it is the last step. Presenting a spreadsheet to an MS is not sufficient. By shaping the data into a compelling message with clear, concise evidential data, your work will come to life.
While there are many solutions available for data visualisation out there, Polimapper can help you build your data dashboards from the ground up. As many MSs look to understand the communities they represent, our data dashboards go beyond visualisation and are tailored to serve as resources guiding parliamentarians through the changes.
Get in touch if you are looking to bring your data to life