It’s one thing to know your app is being downloaded; it’s another thing entirely to know which communities are being reached and which are being left behind. For Alcohol Change UK, the goal wasn’t just to track sign-ups, but to understand the real-world environments that drive – or hinder – behavior change.
Polimapper was commissioned by Alcohol Change UK to dig into the “spatial context” of the Try Dry® app, mapping user data against the unique characteristics of local areas. This sociodemographic research, which has now been published, provides a clear-eyed look at the relationship between where people live and how they engage with digital health tools. It provides Alcohol Change UK with a detailed evidence base for the geography of the charity’s behaviour change programme.
How we carried out the work
To uncover these insights, our team combined Alcohol Change UK’s proprietary user data with a vast array of public datasets to create a multi-layered analytical model.
The process began by taking anonymised postcode data from Try Dry® users and mapping it against various administrative and electoral boundaries; primarily Local Authorities. This allowed us to perform a granular “deep dive” into the relationship between app usage and local characteristics.
Key datasets used in our analysis included:
- Indices of Multiple Deprivation (IMD): We mapped take-up against overall deprivation scores and specific criteria like income, employment, and health .
- 2021 Census Data: This provided a wealth of information on age, sex, ethnic grouping, and economic activity.
- Digital Exclusion Indicators: Using Ofcom data on broadband and 5G availability, we explored whether digital poverty acted as a barrier to app downloads.
- Health Indicators: We compared app usage against NHS data on alcohol-related hospitalisations and regional “at-risk” drinking levels.
The heavy lifting was performed using IBM SPSS Statistics, where we utilised Regression Analysis.
This allowed us to determine if relationships between variables – such as the link between regional health trends and app sign-ups – were statistically significant or merely coincidental.
A glimpse into the results
The findings provided some crucial insights for the future of the Try Dry® programme, and even shaped how it was marketed during the 2025/2026 Dry January period.
By identifying sociodemographic patterns, Alcohol Change UK has visibility over which communities are most active on the app and where there are opportunities to increase support.
Our analysis revealed that sign-ups were significantly more likely in local authority areas characterised by:
- Socio-economic Factors: Lower levels of income deprivation, higher employment rates, and a higher density of managerial or professional workers.
- Education and Health: Higher levels of educational attainment and higher concentrations of ex-smokers.
- Ethnicity: Higher levels of people identifying as “White,” a trend particularly pronounced during the Dry January® challenge.
- Alcohol Consumption Profiles: Areas with higher levels of “higher risk” alcohol consumers (AUDIT-C scores of 8–10) and higher rates of female hospital admissions for alcohol.
The propriety sign up data from Alcohol Change UK also revealed that more women signed up than men, and that those aged 25-49 were more likely to be on the app than those under 25 or over 50 years of age.
These insights helped to shape the marketing strategy for the 2026 Dry January® period. By identifying that older men were under-represented despite facing higher levels of alcohol harm, Alcohol Change UK was able to pivot – pre-testing messaging specifically for men and investing in targeted social media campaigns for the 45+ demographic.
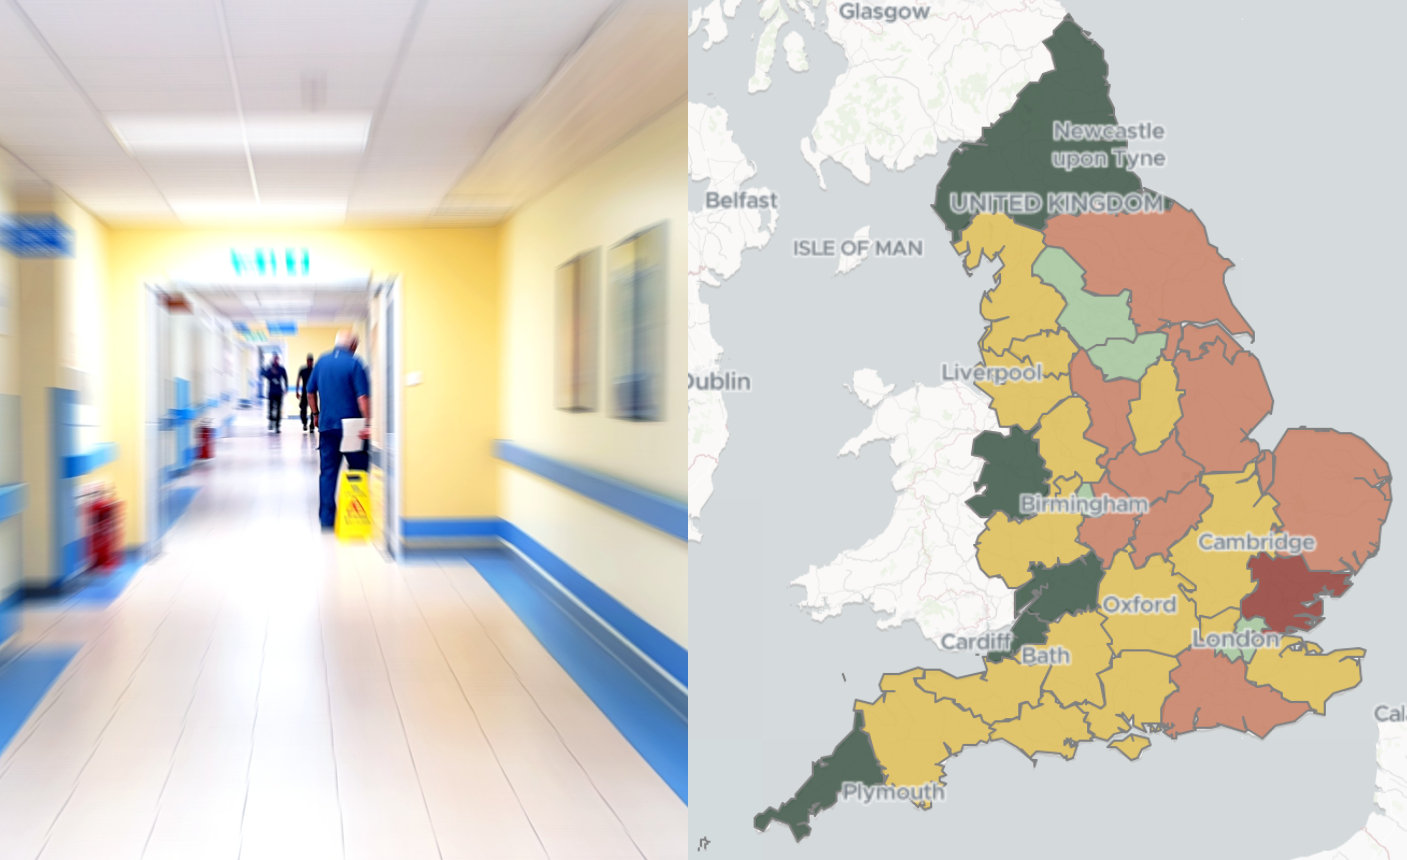
You can read the full breakdown of these findings on the Alcohol Change UK blog. Additionally, we have transformed these complex datasets into an interactive Polimapper visualisation, allowing stakeholders to drill down into local authority data.
Sociodemographic research with Polimapper
Polimapper provides the analytical depth required to transform raw data into strategic intelligence. This project illustrates how understanding socio-demographic trends is as crucial for setting internal organisational direction – such as refining service delivery or targeting marketing resources – as it is for shaping the national policy agenda through evidence-based advocacy.
By identifying the specific characteristics of the communities they reach, organisations can move beyond broad assumptions and develop highly targeted strategies. Our consultancy specialises in this intersection of geography and data, offering:
- Custom GIS Analysis: Mapping your proprietary data against administrative, statistical, and electoral boundaries.
- Public Data Integration: Leveraging the Census, Indices of Multiple Deprivation, and other national datasets to provide deep contextual insights.
- Statistical Modeling: Using advanced techniques like regression analysis to identify causal relationships and predictors of engagement.
- Interactive Visualisations: Creating local area profiles that empower your team to engage stakeholders, from local authorities to Members of Parliament, with clear and persuasive data.
Whether you are looking to identify service gaps, support a funding bid, or drive legislative change, Polimapper provides the evidence base needed to influence policy and engage stakeholders effectively.